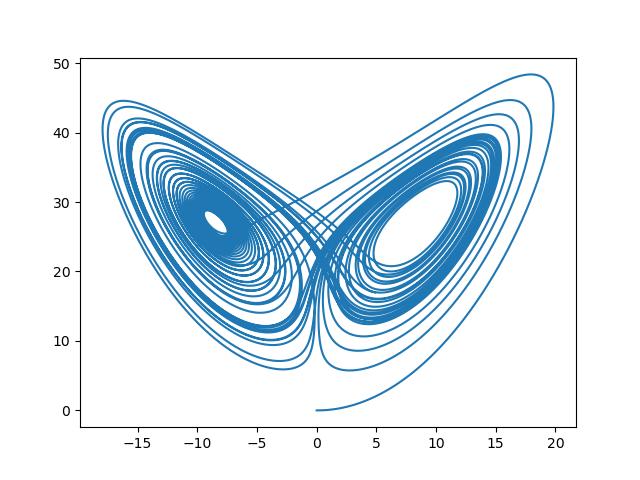
Lorenz Butterfly in Python
If you are new to python, the easiest ways to run this program are to either
- Using a Jupyter notebook (incuding Anaconda and Jupyter-Lab): copy the entire code block into a single
cell and run the cell.
- Using a Python-compatible text editor such as idle or Geany: create a new
file, paste the entire file into the file, save it, and select execute from the
menu.
- On the command line (e.g., the linux terminal): Save the entire program to a file such as
butterfly.py,
then enter python3 butterfly.py
If the plot window does not display or the jpg file is empty, the most
common problems are that your environment is not able to see the scientific
libraries such as numpy, scipy, or matplotlib; or they are not installed.
Check with your system manager.
#
# Lorenz Butterfly
# GPL-3.0-or-later
# license explained at
# https://www.gnu.org/licenses/
#
import numpy as np
from scipy.integrate import odeint
import matplotlib.pyplot as plt

sigma = 10.0
rho = 28.0
beta = 8.0/3.0

#
# defines a system of three differential
# equations to solve
# x'(t), y'(t), z'(t)
#
def f(v, t):
    x,y,z=v
    xprime = sigma*(y-x)
    yprime = rho*x - x*z - y
    zprime = x*y-beta*z
    return np.array([xprime, yprime, zprime])
#
# times is an array of 100,000 t-values
# to be plotted between t=0 and t=50
#
times = np.linspace(0,50,10**5)
#
# initial data: x=0, y=1, z=0
#
v0 = np.array([0.0, 1.0, 0.0])
#
# integrate the differential equation in f
# starting at v0, and calculate results at
# the t-values in times. An array of (x,y,z)
# values (100,000 of them) will be returned
#
result = odeint(f, v0, times)
#
# transpose, to get separate arrays for x, y, and z
#
x,y,z = result.T
#
# plot x as a function of z
# you could also plot x vs. y or y vs z,
# and it would look different
#
# this code creates a plot object internally,
# but does not display it
#
plt.plot(x,z)
fig=plt.gcf()
#
# change file type to save to other formats,
# or comment out to merely display
#
fig.savefig("butterfly-picture.jpeg")
#
# this line is required to display the plot on the screen
#
plt.show()